Best AI breakout scanner? Check volume, range, rotation, and a plan
A breakout scanner is a tool that lists stocks leaving a range. You still need four checks: volume, a tighter range, sector rotation, and a plan with a stop.
People type that search because they want a useful scanner, not a list of two hundred tickers with no context. They want to know if the breakout has volume. A breakout is a close above a prior high.
They want to know if the stock first moved in a smaller range, and if money is flowing into that sector. Sector rotation means money is moving from one industry group to another, and they also want a plan if the idea is wrong.
Those four checks are the job of any scanner, and the software is how you run them each day. Trade Ideas is a real-time US stock scanner, and TradingView is the charting tool many traders already use.
DominantX sits next to both tools on purpose. We built it to follow money from the market to the sector to the stock, then write a plan. Pro costs $25 per month, or $20 per month if you pay yearly.
What should a breakout scanner check?
You can use this list on DominantX, Trade Ideas, TradingView, or a spreadsheet. A scanner should show these four checks, and if it cannot show them, it is not helping you.
Volume confirmation
Price can close above a prior high with little volume. Volume is the number of shares that traded, so that close is only a line on a chart. A close above a prior high with rising volume is a breakout you can study.
You should look at relative volume, not only a green bar. Relative volume compares today with a longer average. The Investor.gov volume glossary defines volume as shares traded.
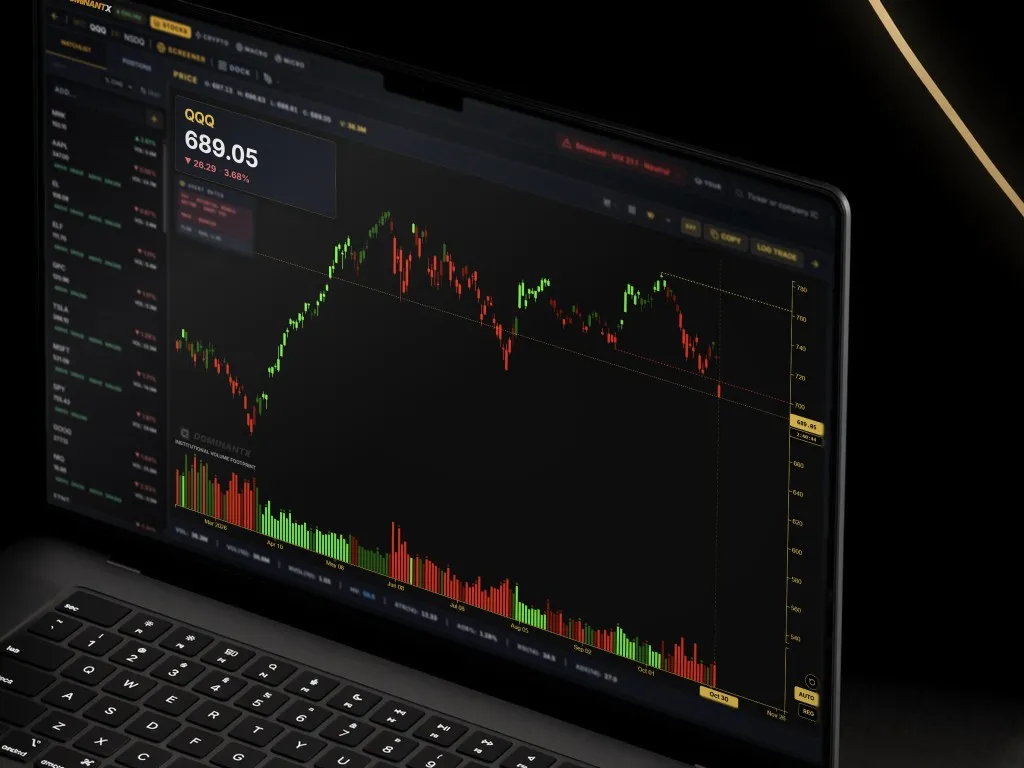
Unusual Volume in DominantX compares volume with a 90-day average, and Exploding Now lists names where volume is expanding. The volume pane under the chart uses the same numbers.
Falling volume inside a range is also information. A range is the distance between recent highs and lows, and quiet volume often appears before the next expansion. That setup is different from a breakout that is already moving.
Tightening range
The best breakouts often start after a pause, and they often do not start after a stock has risen for two weeks. You want a range that is getting smaller and a clear level that price must break.
You want a stop price that is easy to see. A stop is the price where you exit if the idea fails. If the scanner cannot show a tightening range, you may buy late, which is why DominantX names this list the Waiting Room.
The Waiting Room shows stocks that already moved, then paused under a level. The Waiting Room can be empty, and an empty list means you should not force a trade.
Sector rotation
A breakout in a weak industry is one kind of bet, and a breakout in a leading group is a different bet. Most scanners skip this step and start on the ticker.
You should check the index first, then the sector, then the industry, then the stock.
If the group is weak and the stock is rising fast, you are going against the market. If the group is leading and the stock is just leaving a range, you are aligned.
DominantX uses that order. Macro shows the market and the themes, and Micro shows sector and industry relative strength. Relative strength compares how one group is doing versus the market.
Name is the chart, the scanner, and the plan. You can read the Macro to Name path if you want the short walkthrough.
A plan with stops and targets
A scanner that cannot help you place a stop is only half a tool. Before you buy, you should know the price that ends the idea. That price is often back inside the range, or under the last higher low. A higher low is a dip that stays above the prior dip.
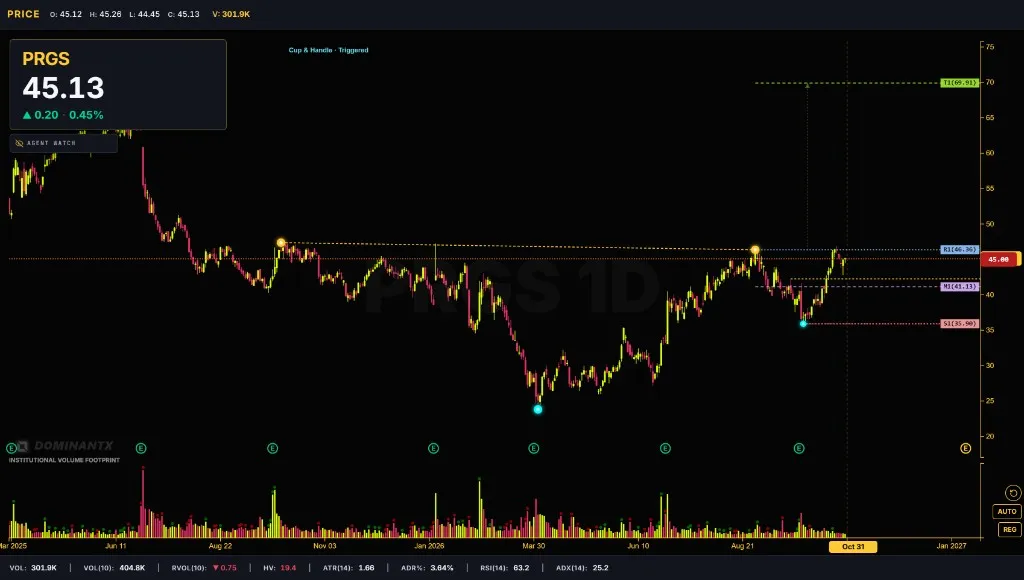
You should know a first target. A target is the price where you take profit, and it can be a prior high or a multiple of average true range. Average true range, or ATR, measures how far price usually moves.
You should know how much of your account that risk uses. DominantX has a trade log with Auto Set SL + Targets that can set a stop and targets from chart structure or from ATR. It does not place the trade for you; it shows the plan so you can accept it or reject it.
How does DominantX run those checks?
DominantX follows a path that starts with Macro. You should start with indexes and themes, and ask whether leadership is still in risk-on groups. Risk-on groups are the parts of the market that lead when investors want more risk.
You should not hunt breakouts with no market context. You can see Macro to Micro for that desk.
Micro comes next. Sector and industry boards show which groups are leading the move, so you pick stocks from groups that are actually in play.
Name comes last. Screeners and the chart share the same numbers for volume, relative volume, ATR, and price levels. Then you watch, log a plan, or pass, because a scanner should not start with random hot tickers.
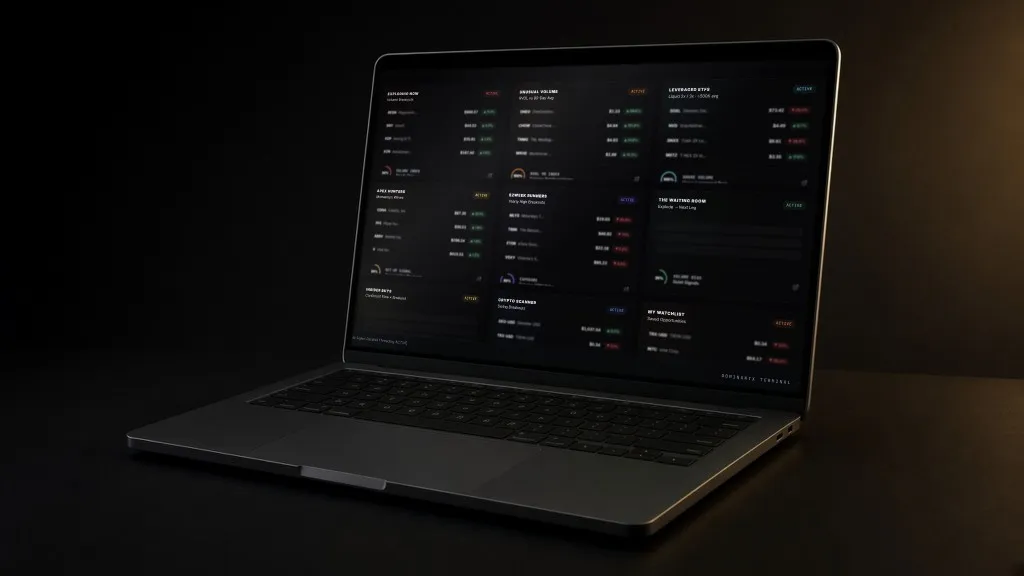
On a single name, the chart is a normal daily chart with volume underneath, and the scanner and the chart should agree.
Not every interesting name is a volume breakout. Insider Buys still has to clear volume and structure checks. A Form 4 is the SEC filing for a company insider trade, and the blank form is the SEC Form 4.
Congress buys are public purchases by members of Congress. If the price is outside the breakout zone, the name stays on a watch list.

How does DominantX compare with Trade Ideas?
Trade Ideas is the established real-time US stock scanner. You should choose Trade Ideas if you need streaming alerts and a scanner built for Windows, which day traders have used for years.
TI Standard costs $127 per month, or $89 per month if you pay yearly, which is $1,068 per year. That price pays for a real-time alert workflow, and it is not the same product as a $25 rotation desk.
TradingView is the established charting canvas that most traders already have. The screeners are broad, the charting is strong, and the social and script community is large.
DominantX does not try to replace that canvas. It tries to answer which names deserve a chart today, and that answer depends on where money is rotating. The longer product comparison is on DominantX vs TradingView.
DominantX is the affordable, rotation-first option. One Pro plan costs $25 per month, or $20 per month if you pay yearly. You can start with a 7-day free trial with no card.
DominantX scans 8,000+ stocks, ETFs, and crypto for volume surges, tightening ranges, and sector rotation. It will not match Trade Ideas on real-time alert density, and it will not match TradingView as a drawing and scripting canvas.
We built it for Macro to Micro to Name, with the Waiting Room and a plan with stops.
| Dimension | DominantX | Trade Ideas | TradingView |
|---|---|---|---|
| Job | DominantX follows rotation, then the name, then a plan. | Trade Ideas runs real-time US scans and alerts. | TradingView is a chart, script, and screener canvas. |
| Breakout checks | It checks volume, Waiting Room ranges, and sector relative strength. | It has a large real-time scan library. | You can build scans on the chart. |
| Coverage | It covers 8,000+ stocks, ETFs, and crypto. | Its heritage is a US equities scanner. | It charts many asset classes. |
| Price (verified) | Pro is $25 per month, or $20 per month yearly. | Standard is $127 per month, or $89 per month yearly ($1,068 per year). | It has a free tier plus paid plans. Check their site for current numbers. |
Trade Ideas Standard prices come from their public pricing page. TradingView plans change by region and promo, so we are not inventing a figure. DominantX checkout on the site is the source of truth if an admin price ever differs.
We do not publish win rates or backtests on this page. If a vendor leads with a performance number, treat it as marketing until you can reproduce it.
What does DominantX cost?
DominantX has one Pro plan at $25 per month, or about $20 per month when you pay yearly. The trial lasts 7 days and does not require a card.
Trade Ideas Standard costs $127 per month, or $89 per month yearly ($1,068 per year). Those prices are different for a reason.
You should pay for Trade Ideas if you need its real-time alert stack. You should use DominantX if you want a rotation-first scanner while keeping your broker and chart.
Who should skip DominantX?
Skip DominantX if you want software to pick entries, size the trade, or hold your whole process in custom chart scripts. Keep Trade Ideas or TradingView for those jobs.
Use DominantX if you already read a chart, care which sector is leading, and want volume, tightening ranges, and a written plan.
FAQ
Is DominantX the best AI breakout scanner?
DominantX is the affordable, rotation-first option next to Trade Ideas and TradingView.
What should a breakout scanner check?
A breakout scanner should check volume versus a baseline and a tightening range before expansion.
It should also check whether the sector and industry are in play. It should help you set a stop and a target you can live with.
Does DominantX scan crypto?
The same terminal covers 8,000+ stocks, ETFs, and crypto, and it scans for volume surges, tightening ranges, and sector rotation.
How do I try DominantX?
You can open a 7-day free trial with no card. Then Pro is $25 per month, or $20 per month if you pay yearly.
These tools use public market data and are not investment advice. This page is for education only, and trading involves a real risk of loss.
Nothing on this page is a recommendation to buy or sell any security. The screenshots show the DominantX Terminal interface and are not performance claims.